Representational Pic
The National Statistics Office (NSO), Ministry of Statistics and Programme Implementation has released the annual publication “Energy Statistics India 2026”. The publication is available at the website of Ministry www.mospi.gov.in.
2. The Publication comprises integrated dataset containing diverse key information about reserve, capacity, production, Consumption and import/export of all the energy commodities (like Coal, Lignite, Petroleum, Natural Gas, Renewable Energy, etc.) of India. The publication also contains different tables (like Energy Balance), graphs (like Sankey Diagram), and Sustainable Energy Indicators as per International Standards.
Improvements in the publication:
3. The 33rd edition of the publication has enhanced its’ coverage by incorporating aspects like Credit Flow to domestic energy-sectors, world energy-statistics etc.; have effectively addressed the major data gaps like consumption of domestic Coal through e-Auction, imported non-Coking Coal, sub-sectoral consumption pattern of electricity under Industry by utilizing the data from the Annual Survey of Industries (ASI) database. Further information like the industry-wise distribution of HSD through Retail/Reseller, the International Aviation and Marine Bunker Data have also been incorporated in the domestic supply/consumption of energy for the 1sttime.
4. The publication has brought harmonization among the sectoral end-use consumption Statistics of all Energy Commodities by standardizing the end-use sectors.
Key Highlights
5. During the FY 2024-25, the Indian economy has depicted a healthy expansion in the Total Primary Energy Supply (TPES) registering a growth of 2.95% over the past year and stood at 9,32,816 KToE(Kilo Tonnes of oil Equivalent).

- India has a huge potential for generation of renewable energy which stands at 47,04,043 Megawatt as on 31-Mar-25. In the total potential, the Solar Energy has witnessed a staggering growth from 748,990 Megawatt during FY: 2023-24 to 33,43,378 Megawatt during FY: 2024-25 and is having the highest share (around 71%) followed by Wind Power (11,63,856 Megawatt) and Large Hydro (1,33,410). More than 70% of the total potential for generation of renewable energy is concentrated in the following six(6) States viz. Rajasthan (23.70%), Maharashtra (14.26%), Gujarat (9.10%), Andhra Pradesh (9.1%), Karnataka (8.59%) and Madhya Pradesh(8.09%).
- The installed-capacity for generating electricity (including Utility and Non-Utility) from the Renewable resources has also experienced a significant growth over the past years. From 90,134 Mega Watt as on 31-Mar-2016, it has risen to 2,29,346 Mega Watt as on 31-Mar-2025, which is a CAGR of 10.93% over the years.
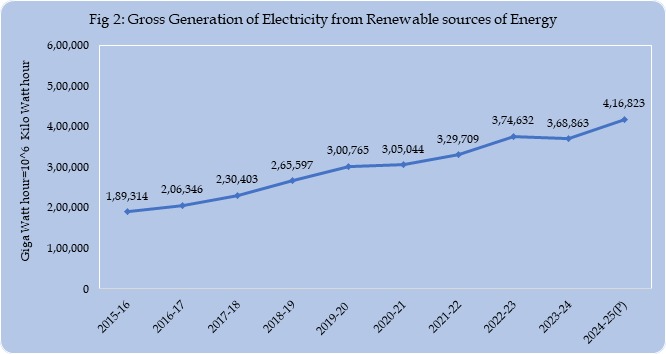
- The gross generation of electricity from the Renewable resources (both Utility and Non-Utility together) has also increased significantly over the years. From an amount of 1,89,314 GWH of electricity generated during FY 2015-16, it has increased to 4,16,823 GWH during FY 2024-25, which is a CAGR of 9.17% over the years.
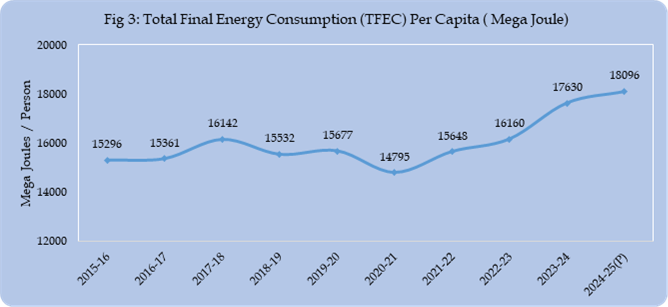
- The per-capita consumption of energy over the years has gone up from 15,296 Mega Joule/person during FY 2015-16 to 18,096 Mega Joule/person during FY 2024-25 which is a CAGR of 1.89% over the years.
- The utilization of the electricity has significantly improved over the years on account of reduction in the transmission and distribution losses. Percentage loss due to Transmission and Distribution which was around 22% during FY 2015-16 has gone down to around 17% during FY 2024-25.
- Among all the major energy supply sources, coal has remained the dominant source, contributing the highest share to the total energy supply. Energy supply from coal (including lignite) has increased from 3,87,761 Ktoe in FY 2015-16 to 5,52,315 Ktoe in FY 2024-25. All other sources like Crude Oil, Natural Gas etc. have also registered a consistent growth over the periods.
- The Total Final Consumption (TFC) of energy, into different end-use sectors, has also experienced a steady rise. TFC of energy surged by over 30.41 % from 4,69,212 Ktoe in FY 2015-16 to 608,578 Ktoe in FY 2024-25.
- The Credit Flow to the energy sector in India has also experienced a steadfast growth over the years. From an amount of ₹ 1,688 Cr during 2021, it has gone up to ₹10,325 crore during 2025 which is a growth of over six times during this period.