
Administrator
31 July 2021
For the first time, the Centre has procured 869.29 LMT of paddy during KMS 2020-21 and 433.32 LMT of wheat during RMS 2021-22, a highest ever procurement in India.
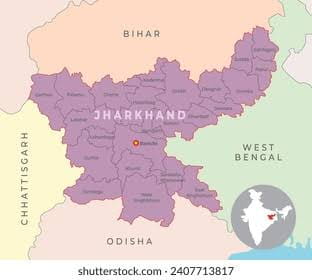
Minus Jharkhand of course ( see the table below), some other state governments have also recorded highest ever procurement of foodgrains during current year.
Once again sad to reiterate, Jharkhand procured zero weight of paddy and wheat.
Official Data are as follows
Wheat: Punjab, Uttar Pradesh, Rajasthan, Uttrakhand, Gujarat, Himachal Pradesh and Jammu & Kashmir have recorded highest ever procurement during RMS 2021-22.
Paddy: Punjab, Bihar, Gujarat, Telangana, Jharkhand, Kerala, Madhya Pradesh, Odisha, Tamil Nadu, Uttrakhand and Uttar Pradesh have recorded highest ever procurement during KMS 2020-21.
Coarsegrain: The State Government of Gujarat, Haryana, Karnataka, Madhya Pradesh, Maharashtra and Uttar Pradesh have recorded highest procurement during 2020-21 as compared to procurement during last five years.
|
PROCUREMENT OF WHEAT AND VALUE AT MSP |
||||||||
|
Procurement figures are in LMT , Rs in Crore (as on 20.07.2021) |
||||||||
|
SL No |
STATES/ UTs |
RMS 2019-20 |
RMS 2020-21 |
RMS 2021-22 |
||||
|
Procurement |
MSP Value (Rs 1840/Qtl) |
Procurement |
MSP Value (Rs 1925/Qtl) |
Procurement |
MSP (Rs 1975/Qtl) |
|||
|
1 |
Punjab |
129.12 |
23758.08 |
127.14 |
24474.45 |
132.10 |
26089.75 |
|
|
2 |
Haryana |
93.20 |
17148.80 |
74.00 |
14245.00 |
84.93 |
16773.68 |
|
|
3 |
Uttar Pradesh |
37.00 |
6808.00 |
35.77 |
6885.73 |
56.41 |
11140.98 |
|
|
4 |
Madhya Pradesh |
67.25 |
12374.00 |
129.42 |
24913.35 |
128.16 |
25311.60 |
|
|
5 |
Bihar |
0.03 |
5.52 |
0.05 |
9.63 |
4.56 |
900.60 |
|
|
6 |
Rajasthan |
14.11 |
2596.24 |
22.25 |
4283.13 |
23.40 |
4621.50 |
|
|
7 |
Uttrakhand |
0.42 |
77.28 |
0.38 |
73.15 |
1.44 |
284.40 |
|
|
8 |
Chandigarh |
0.13 |
23.92 |
0.11 |
21.18 |
0.17 |
33.58 |
|
|
9 |
Delhi |
0.00 |
0.00 |
0.00 |
0.00 |
0.06 |
11.85 |
|
|
10 |
Gujarat |
0.05 |
9.20 |
0.77 |
148.23 |
1.71 |
337.73 |
|
|
11 |
Jharkhand |
0.00 |
0.00 |
0.00 |
0.00 |
0.00 |
0.00 |
|
|
12 |
Maharashtra |
0.00 |
0.00 |
0.00 |
0.00 |
0.01 |
1.98 |
|
|
13 |
Himachal Pradesh |
0.01 |
1.84 |
0.03 |
5.78 |
0.13 |
25.68 |
|
|
14 |
Jammu & Kashmir |
0.00 |
0.00 |
0.00 |
0.00 |
0.24 |
47.40 |
|
|
15 |
West Bengal |
0.00 |
0.00 |
0.00 |
0.00 |
0.00 |
0.00 |
|
|
TOTAL |
341.32 |
62802.88 |
389.92 |
75059.60 |
433.32 |
85580.70 |
||
|
STATEMENT SHOWING STATE WISE PADDY PROCUREMENT & VALUE AT MSP |
||||||
|
Procurement Fig. in LMT , MSP in Rs. Crores (as on 20.07.2021) |
||||||
|
STATES |
KMS 2019-20 |
KMS 2020-21 |
KMS 2021-22 |
|||
|
Procurement |
MSP Value (Rs 1835/Qtl) |
Procurement |
MSP Value (Rs 1888/Qtl) |
Procurement |
MSP Value (Rs 1960/Qtl) |
|
|
ANDHRA PRADESH |
82.58 |
15153.43 |
82.60 |
15594.88 |
NIL |
|
|
TELANGANA |
111.26 |
20416.21 |
141.01 |
26622.69 |
||
|
ASSAM |
3.15 |
578.03 |
1.88 |
354.94 |
||
|
BIHAR |
20.02 |
3673.67 |
35.59 |
6719.39 |
||
|
CHANDIGARH |
0.22 |
40.37 |
0.28 |
52.86 |
||
|
CHHATISGARH |
74.86 |
13736.81 |
59.35 |
11205.28 |
||
|
GUJARAT |
0.21 |
38.54 |
1.10 |
207.68 |
||
|
HARYANA |
64.28 |
11795.38 |
56.55 |
10676.64 |
||
|
HIMACHAL PRADESH |
0.00 |
0.00 |
0.00 |
0.00 |
||
|
JHARKHAND |
3.80 |
697.30 |
6.28 |
1185.66 |
||
|
JAMMU & KASHMIR |
0.15 |
27.53 |
0.38 |
71.74 |
||
|
KARNATAKA |
0.61 |
111.94 |
2.06 |
388.93 |
||
|
KERALA |
7.10 |
1302.85 |
7.65 |
1444.32 |
||
|
MADHYA PRADESH |
25.97 |
4765.50 |
37.27 |
7036.58 |
||
|
MAHARASHTRA |
17.42 |
3196.57 |
18.19 |
3434.27 |
||
|
ODISHA |
70.57 |
12949.60 |
77.38 |
14609.34 |
||
|
PUNJAB |
162.33 |
29787.56 |
202.82 |
38292.42 |
||
|
NEF (Tripura) |
0.21 |
38.54 |
0.22 |
41.54 |
||
|
TAMIL NADU |
32.41 |
5947.24 |
37.93 |
7161.18 |
||
|
UTTAR PRADESH |
56.57 |
10380.60 |
66.84 |
12619.39 |
||
|
UTTRAKHAND |
10.18 |
1868.03 |
10.62 |
2005.06 |
||
|
WEST BENGAL |
27.03 |
4960.01 |
23.29 |
4397.15 |
||
|
TOTAL |
770.93 |
141465.66 |
869.29 |
164121.95 |
||
|
PROCUREMENT OF COARSEGRAINS AND VALUE AT MSP |
||||||||||
|
As on 20.07.2021 |
||||||||||
|
KMS |
COMMODITY |
GUJARAT |
HARYANA |
KARNATAKA |
MADHYA PRADESH |
MAHARASHTRA |
UTTAR PRADESH |
TOTAL PROCUREMENT (In MT) |
MSP Value (Rs. In Lakh) |
|
|
2019-20 |
JOWAR (Kharif) |
0 |
0 |
838 |
5469 |
1468 |
0 |
7775 |
1998 |
|
|
JOWAR (Rabi) |
0 |
0 |
8418 |
0 |
7145 |
0 |
15563 |
4000 |
||
|
BAJRA |
0 |
100000 |
0 |
76 |
0 |
0 |
100076 |
20015 |
||
|
MAIZE (Kharif) |
0 |
0 |
0 |
0 |
19 |
25 |
44 |
8 |
||
|
MAIZE (Rabi) |
0 |
0 |
0 |
0 |
115094 |
0 |
115094 |
20257 |
||
|
RAGI |
0 |
0 |
193243 |
0 |
0 |
0 |
193243 |
60872 |
||
|
Total |
0 |
100000 |
202499 |
5545 |
123726 |
25 |
431795 |
107149 |
||
|
2020-21 |
JOWAR(Kharif) |
0 |
0 |
80722 |
29582 |
17784 |
0 |
128088 |
33815 |
|
|
JOWAR(Rabi) |
0 |
0 |
0 |
0 |
7696 |
0 |
7696 |
2032 |
||
|
BAJRA |
11515 |
150000 |
0 |
195351 |
5005 |
0 |
361871 |
77802 |
||
|
MAIZE(Kharif) |
4133 |
0 |
0 |
0 |
88283 |
106413 |
198829 |
36783 |
||
|
MAIZE(Rabi) |
0 |
0 |
0 |
0 |
6199 |
0 |
6199 |
1147 |
||
|
RAGI |
0 |
0 |
474098 |
0 |
0 |
0 |
474098 |
156215 |
||
|
Total |
15648 |
150000 |
554820 |
224933 |
124967 |
106413 |
307795 |
|||
|
2021-22 |
|
Nil |
||||||||
|
Procurement of Pulses under Price Stabilisation Fund (PSF)Scheme(as on 22.07.2021) |
||||
|
Year |
Pulses |
STATE |
QUANTITY PROCURED (IN MT) |
VALUE (IN Rs. CRORE) |
|
2019-20 |
Tur Kharif 2019 |
Telangana |
88,281.14 |
512.03 |
|
Karnataka |
77,196.75 |
447.74 |
||
|
Andhra Pradesh |
11,085.05 |
64.29 |
||
|
Gujarat |
6,132.64 |
35.57 |
||
|
Total |
1,82,695.57 |
1,059.63 |
||
|
Masoor |
Madhya Pradesh |
92.97 |
0.50 |
|
|
Total |
92.97 |
0.50 |
||
|
2021-22 |
Masoor Rabi 2021 |
Madhya Pradesh |
15,323.61 |
95.41 |
|
Uttar Pradesh |
7,064.69 |
43.77 |
||
|
Bihar |
47.48 |
0.32 |
||
|
West Bengal |
122.00 |
0.80 |
||
|
Total |
22,557.77 |
140.30 |
||
|
Moong |
Madhya Pradesh |
63,824.75 |
459.28 |
|
|
Total |
63,824.75 |
459.28 |
||
|
Source: Department of Consumer Affairs |
||||